
Scientific publishing hasn’t changed a lot since I was born, and that was quite a while ago. It is standardized and has worked efficiently for authors and publishers alike. The optimal article outline consists of title, abstract, background, materials and methods, results and discussion. Add some dreary tables and result diagrams, and years of research efforts as well as countless hours of work vanish into a crowded jungle of written scientific information, waiting to be found and read alongside other materials and publications which look similar and compete for attention at the same time.
We live in a changed scientific communication landscape
Our communication landscape has changed with the arrival of the Internet. It does not matter whether we are trying to organize our private or our business lives, we use online sources for that. Most information uptake happens online, and the vast amount of available data and information has transformed the way we seek, select, process and disseminate this information. We no longer want to read and digest big bodies of text. We prefer shorter and visually appealing formats. We like persuasive illustrations, photos, animated GIFs or entertaining videos that are easy to grasp and to remember. After all, humans are visual creatures.
Why? Unlike text, which must be scanned and decoded character by character by our brains, our visual system can process multiple images simultaneously. Information presented in pictures can be absorbed and understood better, a phenomenon known as the Picture Superiority Effect.1
Recognition tests have shown that the human brain can remember more than 2,000 pictures with at least 90% accuracy, even with short periods of presentation times.2 Visuals are processed 60,000 times faster than text and when visual assets were added to a presentation it was found to be 43% more persuasive.3
Therefore, more than ever, attractive visual content is what will get our attention. And science is no exception.
What does this mean for scientific publishing?
Even 10 years ago, Elsevier was announcing that it would publish all articles in its collection of Cell Press journals in a new “Article of the future” format. It was a new method to reorganize the traditional sections of a research article to an integrated, linked navigation scheme using tabbed navigation. Additionally, a graphical abstract (GA) and a bulleted highlights section on the landing page of each article were added, complementing the abstract text with an easily reviewable visual summary of the article.
See for yourself that this format not only enhances the appearance of online publications but looks appealing in the printed version as well:
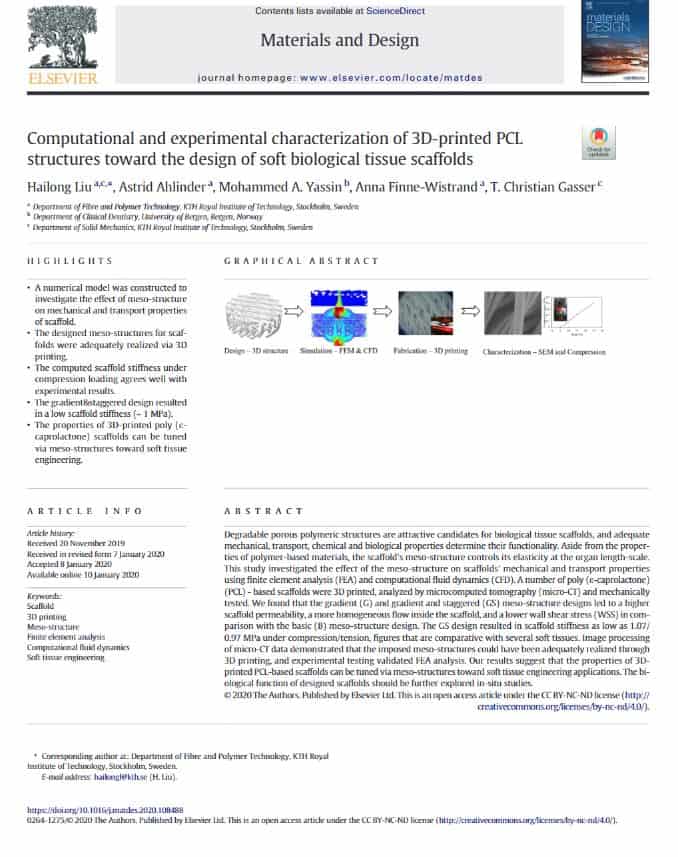
Screenshot showing how the addition of a graphical abstract visually enhances not only online but also print versions. (Source: https://www.sciencedirect.com/science/article/pii/S0264127520300216)
Since then, many scientific journals (mostly online) and publishers have in one way or another followed this example and adapted their approach to online. They improve their readers’ experience by offering, for example, tabbed navigation, searchable sections, article highlights, and figures that are clickable and enlarge as well as article share options. Other journals have not changed anything and are still focused on print.
The internet is fostering exponential information proliferation. Without being held to any measure of scientific scrutiny, such as peer review or empirical data, publishers are able to create online journals that are freely accessible to the public. Not only does this lead to an extremely crowded scientific information landscape with higher competition for audience interest, but it also becomes challenging for scientists to find and select credible information on the topic of interest.
Therefore, how scientists communicate, present and distribute their work will determine to a significant extent how their findings, their ‘content’, is received.
It is no longer enough to produce groundbreaking research and to publish it. It is important to make sure that the results can be found and stand out. Effective dissemination of research results, using online channels like institutional websites or ResearchGate as well as LinkedIn, Twitter and Facebook, are not to be underestimated as success factors.
One great way to make your publication stand out visually is with the addition of a graphical abstract.
Why do we need graphical abstracts in our scientific publications?
First, let’s start with the definition. A graphical abstract is a concise pictorial summary of the research and findings presented in a publication. Its goal is to aid comprehension by making the often complex information more easily accessible to wider audiences through a visual that communicates the main message in a short time frame. Remember, a picture is worth a thousand words.
For the skeptics amongst you, a GA is not thought to be a replacement for the classical written abstract but rather an addition to it. See for yourself how graphical abstracts stand out in search results in the example below.
Of course, not everybody in the scientific community is thrilled about the extra work that is needed to create a good graphical abstract. Often, authors just see it as another figure, and even use a figure from the publication for it.
Therefore, let’s approach it from another angle to provide you with a good, convincing rationale.
Of course, authors know “what” a graphical abstract is. For the ones who do not know, all journals that publish GAs describe what it is on their websites. However, journals often fail to make a point about “why” they are needed and “how” they are best created in their instructions to authors. Without that, authors see just the extra work and not the added value or opportunity that GAs are able to create.
Is it not the goal of every author to have their research paper read and cited by as many fellow scientists as possible? Adding a compelling graphical abstract to your research will support this ambition.
How? It makes your article visually attractive and ensures it stands out from the crowded content space. It also supports information retention and information recall: we have already learned how visuals can affect recognition.
Another opportunity, which remains largely underestimated, is that a GA can drive web traffic to an author’s research and open doors. It can help capture the audience’s attention, spark interest in the particular topic, and point to other research. Besides increasing scientific credibility, more attention from the crowd may eventually lead to new cooperation or new funding opportunities.
Good design examples
I personally love graphical abstracts that show the flow of experiments and their conclusions. It is especially important to me that they are not too colorful.
As showing is better than telling, have a look at the examples below to see what a good graphical abstract could look like:

Screenshot of an example of a GA in orthogonal layout (Source: https://www.cell.com/cell-reports/fulltext/S2211-1247(19)31643-2)

Screenshot of an example of a GA in zigzag layout (Source: https://www.cell.com/cell-stem-cell/fulltext/S1934-5909(18)30492-2)
Convinced and eager to give it a go? Then stay tuned for Part II of this article where we will provide tips on how to start and what tools to use for best results.
We’ll also touch on the importance of promoting your research and how graphical abstracts can be an effective visual mean to help you disseminate your research results more effectively in today’s crowded scientific communication space.
References
Paivio A, Csapo K. Picture superiority in free recall: Imagery or dual coding? Cognitive Psychology. 1973; 5(2):176–206.
Grady CL, McIntosh AR, Rajah MN, Craik FIM. Neural correlates of the episodic encoding of pictures and words. Proceedings of the National Academy of Sciences. 1998;95(5):2703–8. Available from https://www.pnas.org/content/95/5/2703
Morrison J, Vogel D. The impacts of presentation visuals on persuasion. Information & Management. 1998;33(3):125-135.
* Please note that this post does not claim completeness and comes without guarantee. It serves informational purposes only.
We greatly appreciate comments and discussions around this topic and will make sure to incorporate your valued feedback. Please leave feedback here, unfortunately we had to switch the comment section off.