
Increasing Research Visibility & Interest by embracing appropriate online dissemination
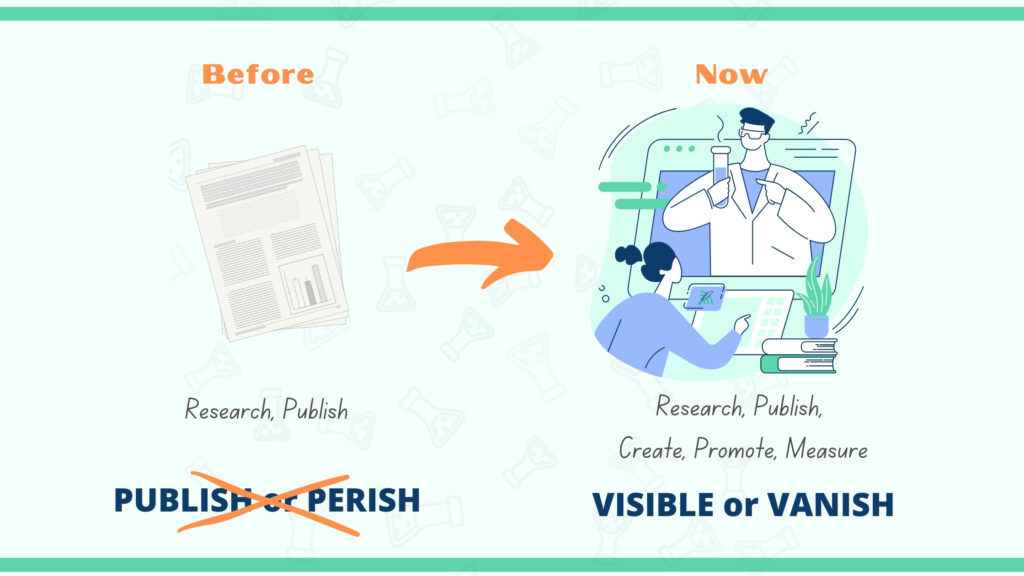
The academic world has changed and research visibility is much harder to achieve. An estimated 2.5 million new papers are published every year. But this number has certainly and substantially increased now due to research interest on Covid-19. Only six months into the pandemic, the number of published coronavirus articles indexed on Web of Science […]
How to create a good visual for your Medical Writing

Creating compelling visuals doesn’t have to mean reinventing the wheel. Armed with the right online software and basic design principles, even the least digitally minded writer can produce visual accompaniments to their work. Use the principles outlined in medtextpert’s feature article for the March issue of the EMWA journal to create and disseminate visual content […]
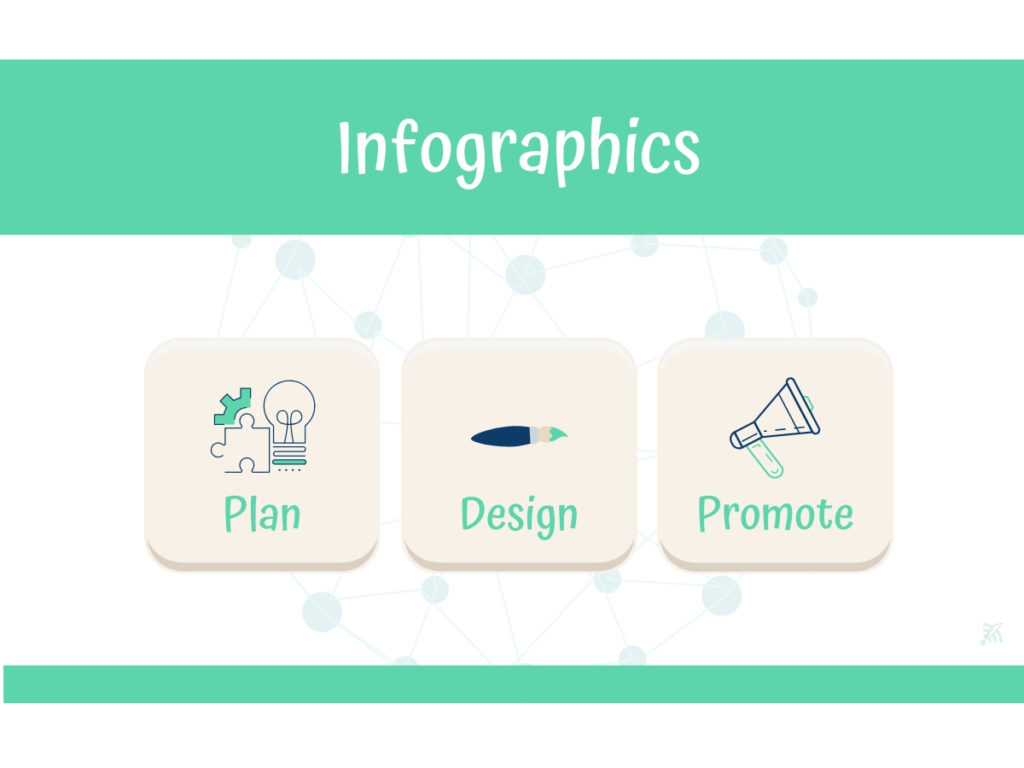
Want An Infographic? – Design-It-Yourself (DIY)
Most of us love visually appealing infographics. But what are they? According to the Oxford English Dictionary, an infographic (or information graphic) is “a visual representation of information or data”. As the name suggests, they combine information and graphics to increase understandability at a glance. In today’s fast-paced information landscape, providing visually attractive content is […]