
The academic world has changed and research visibility is much harder to achieve.
An estimated 2.5 million new papers are published every year. But this number has certainly and substantially increased now due to research interest on Covid-19. Only six months into the pandemic, the number of published coronavirus articles indexed on Web of Science and Scopus (between 1 January and 30 June 2020) was already reported to be over 23,600. Scientific information overload is a term that sums it up perfectly, not just for articles covering Covid-19.
But not only the amount of published scientific information has increased. The way we search and process it has changed fundamentally with the rise of online communication. The consequences are manifold. Scientists are now under a lot more pressure a) to find a journal to publish their research and b) to increase research visibility to get recognized and to demonstrate that their findings have an impact on society.
There is only one way to confront that challenge: to have a well-thought-out, strategic online dissemination strategy.
Sounds intimidating, right? It sure would freak me out as it adds to the whole publication journey big time.
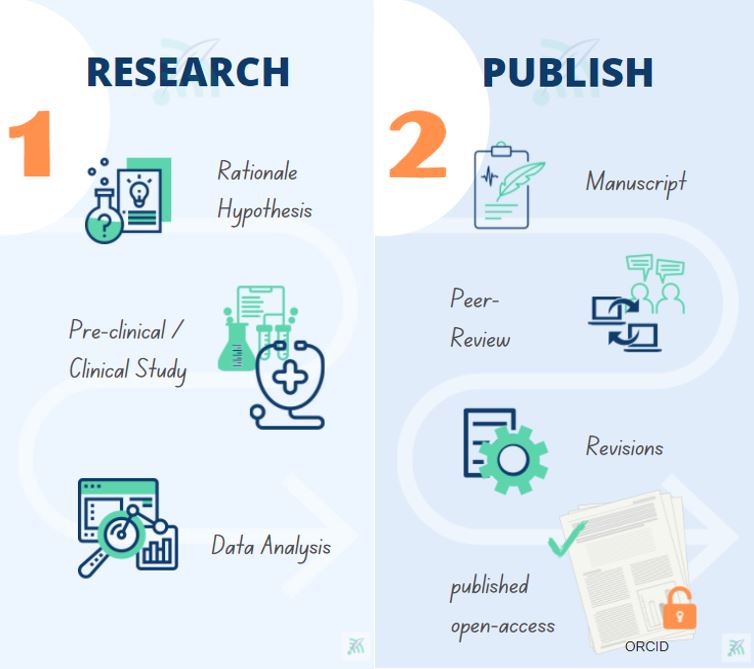
So now, after all that work involved in planning and conducting your research followed by thorough data analysis and writing up the paper (again following increasingly detailed publication guidelines and peer-review), you have just arrived somewhere past the middle (or three quarters) of that journey. Now actually, you have to change cars (to use a racing analogy), or at least change tires, as the last section of the road involves challenging terrain.
After planning, it entails having to create, effectively communicate and promote suitable, engaging online communication assets that are not only picked up by your human but also the non-human audience.
As this may be way trickier (and resource-intensive) than it seems at first sight, we would like to share some tips with you today. Tips, that will not only help you plan, but also show you what to pack, how to set out on your journey, and what signs to watch out for to get you where you want to be.
Have a plan on how to increase your research visibility
As a frequent reader of medtextpert’s blogs, you may have noticed that we talk a lot about strategy first. Not that we don’t know that you know that, but because we don’t see it meticulously put into practice in scientific communications, especially not for the off-road promotional part that is mandatory to increase your research visibility and impact.
Choose your audience
Having a plan means that you should start out picturing your audience. Keep in mind that your human audience is not just your fellow scientists or colleagues (“experts“), but there are at least two more sub-categories to consider, all requiring different information on the same subject: the “managerial” and the “lay” audience. Read more here.
But there is more audience to be considered, namely the non-human audience. Although you might think now, they’ve gone crazy, and please stay with us to explain. The technology embedded in online underlies algorithms, and artificial intelligence makes many everyday decisions for us. Amongst them also suggestions for appropriate content provided as search result – answer to specific scientific information we were looking for. Those suggestions are based on our search intent, interests, past searches, and of course, on the available online content that is categorized (“in-store” and known) by those algorithms. Therefore, if you want your research findings to pop up as search results, you have to do something to recognize and categorize them.
How? Search Engine Optimization (SEO) techniques, including keywords to all your online content assays.
But let’s first give you an overview about how to turn your complex research results into attractive, straightforward, and easy-to-understand visual content elements that get seen by your audience(s). Knowing your options helps you plan creation and dissemination adapted to your target audience and specific channel and feeds your strategy.
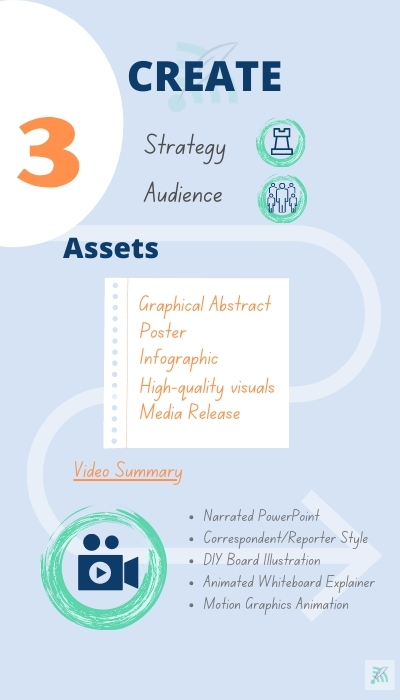
Attractive at first sight - Online Communication Assets that help increase your research visibility
Graphical Abstract
A graphical abstract is a concise, pictorial summary of the research and findings summarized in the publication. Its goal is to aid comprehension of complex information through a visualization to communicate the main message quickly. Find more on graphical abstracts, good examples, tips, and tools in our blog series here.
Adding a graphical abstract to your publication, as it is now mandatory in many journals, is one of the most straightforward and straightforward approaches when creating online communication assets. They still feel scientific and most relatable to your research. They are there to grab attention and drive traffic to your paper.
Poster
The same holds for posters. You are used to creating them, and they may not even seem like extra work, as you already counted in having to produce one or two along the way. BUT, a poster does not equal a sign. Gone are the days where you can gear them with text and illustrations just out of your research or publication. Even in traditional poster sessions, nobody will stop at your exhibit if it is not visually compelling unless someone seeks you out on purpose. A poster should be there to attract, and then there is you, elaborating on the details that will hopefully prompt a scientific exchange. On top of that, remember that a poster is no longer limited to a printed version only but now comes in various formats and often online as an ePoster.
As mentioned before, the way we seek and process information has changed. We have become much more visually driven and stay away from too much text, which of course, is in our nature.
Good posters arouse interest by an attractive visual representation of the facts, including compelling illustrations, a striking color scheme, carefully chosen fonts and background, as well as enough white (or negative) space to start with.
ePosters are ideal online content assets and offer plenty of possibilities to showcase more of your research profile. You can easily add interactive elements to it through links to your Twitter, LinkedIn, or ResearchGate profiles (handles), your lab’s website, the published paper, the graphical abstract, or a link to additional data available on open-access repositories (e.g., Data Dryad, FigShare). ePosters can be downloaded as pdf or lead the visitor to a landing page. They greatly enhance your research visibility.
Infographics
Another content option that could help promote your research and subsequent publication (and not so much different from posters) is all sorts of infographics: from simple illustrations combined with some text to extensively illustrated representations that cover the whole research project, divided into several sections.
From data visualization to visual storytelling – infographics are versatile. They break down complex information and are utile in educating the managerial and lay audience. If you want to find out more, head to our blog on DIY infographics.
Video Summaries
Scientific journal articles, especially in the conventional format, are often tough to read and grasp. So how else to best present your findings and engage your peers and public audience? Wouldn’t a video summary of your research or study seem very appealing, which could just be watched as we sit back? It would. And it would make a great piece of promotional content that could be used across channels and would score big even with the non-human audience we were talking about earlier.
Video summaries can come in all sorts of formats – from simple DIY video footage to more sophisticated animated motion graphics. The choice is yours liable on your goals, research, message, available resources and skills, and of course, your openness. Luckily you are already used to conference proceedings and webinars uploaded on YouTube. Not to forget image films of your organization or other educational or instructional materials, interviews, short portraits, or journal clubs to get back to publication-related strategies.
Here an example of a journal club. In case the video does not play – here the direct link: https://www.youtube.com/watch?v=lzAoWs6w8q8.
Therefore, it’s time to join in and not being left behind.
Example Video Summaries
Narrated PowerPoint Video
A straightforward approach to Video is to line up carefully chosen PowerPoint Slides and save them as a video to tell the section of your research. Create uncluttered, clear visuals and follow the guidelines that should be applied to ineffective presentations. This is free, and you have everything you need to get started. It’s ideal footage to be used in combination with other Video styles as well.
Correspondence/Reporter Style Video
Put yourself or one of your team members in front of a camera, explain what the research was about, and add your findings. You can also add other sequences to it and add text lay-over later.
A straightforward example (in tribute to my former professional “life”) on: https://youtu.be/Y1vGsqLL_Nc – thank you Claudio Ronco.
DIY Board Illustration Video
Record while you are illustrating your critical messages on black- or whiteboard, just as you have done many times before on paper when explaining to students or colleagues. The voice-over can be added separately so you can focus on the drawing.
Animated Whiteboard Explainer Videos
Using specific design software (e.g., Doodly, MySimpleShow, Animaker) enables you to create an animated graphical abstract, mechanism of action, or concept appealing, straightforward, and easy to grasp. Whiteboard Explainer Videos are pretty cost-effective and our favorite video option.
Motion Graphics Animation Video
You can add motion to animation, be it 2D (e.g., OpenToonz, Pencil 2D, Toon Boom Harmon) or 3D (e.g., Blender), not only to enhance your message but the experience for your audience.
If you are skilled enough or have sufficient resources for video production, you could also combine some of the styles mentioned above to showcase your work perfectly. Don’t just explain your research’s background, methods, and results – tell a story that can be watched and remembered.
Media Release
Let’s finish with one tactic we have not touched on yet because it does not precisely fit into the visual online content asset – Writing a media release about your published paper. It is a very effective way to promote your research and publication. Especially if done right and picked up by journalists, a media release can increase the reach of your message many times over and raise your scientific profile and have a significant effect on your recognition.
Now, well prepared for the final stage, all that remains is to cover the last stretch. This is still a challenge for many scientists, not just because of the technicalities involved or the missing time. But because they are not used to systematically having to promote their work. And let me tell you – even at medtextpert, we always find excuses for not posting a testimonial or letting our followers know what we are doing or why we should not share How-to tips. Not just because of time restraints. But because self-promotion feels awkward. It’s much easier to stay in the background and help you out.
Spread the word - Online Dissemination Options
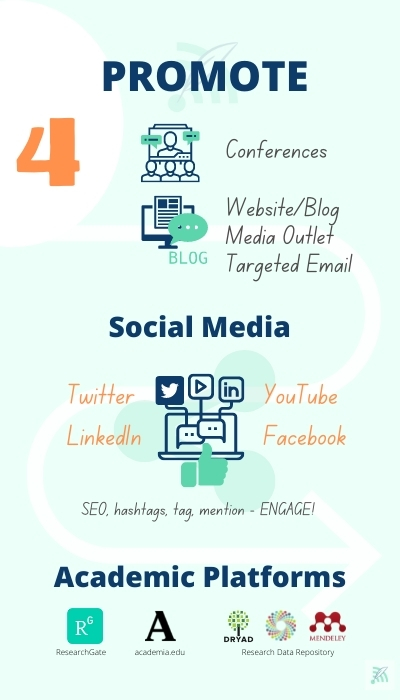
All content formats discussed earlier are significant elements that aid online dissemination and promotion.
They can not only be shared via your own or institutional website or blog. No, they lend themselves to land on platforms like open-access repositories or your social media channels, first and foremost Twitter and LinkedIn.
Social Media
When posting on social media, the best practice is to make sure your content asset is adapted to the channel-specifics (e.g., format, resolution), is enlarging or downloadable, SEO-optimized, and includes a URL link article’s pdf. This will help drive traffic to your paper and make your social media post (Twitter!) visible by the Altimetric or Plum X algorithm.
You should add relevant hashtags in the accompanying post, mention the journal, your organization, and funding bodies. Tag your co-authors or colleagues and prompt interaction by adding a clear Call-to- Action (CTA). Most important, moderate comments and actively participate in the discussion following the post. Track the “performance” of your posts by checking inbuilt analytics, or you’re (hopefully) linked Google Analytics Account.
Videos
All your videos are to go optimized on your YouTube channel. Use a unique SEO title, a spot-on description, high-volume ranked tags, hashtags, and quality keywords. Make sure to add an HD custom thumbnail. Share your videos to your channels using the published video URL.
A good example of a video channel using different video formats that of NEJM.
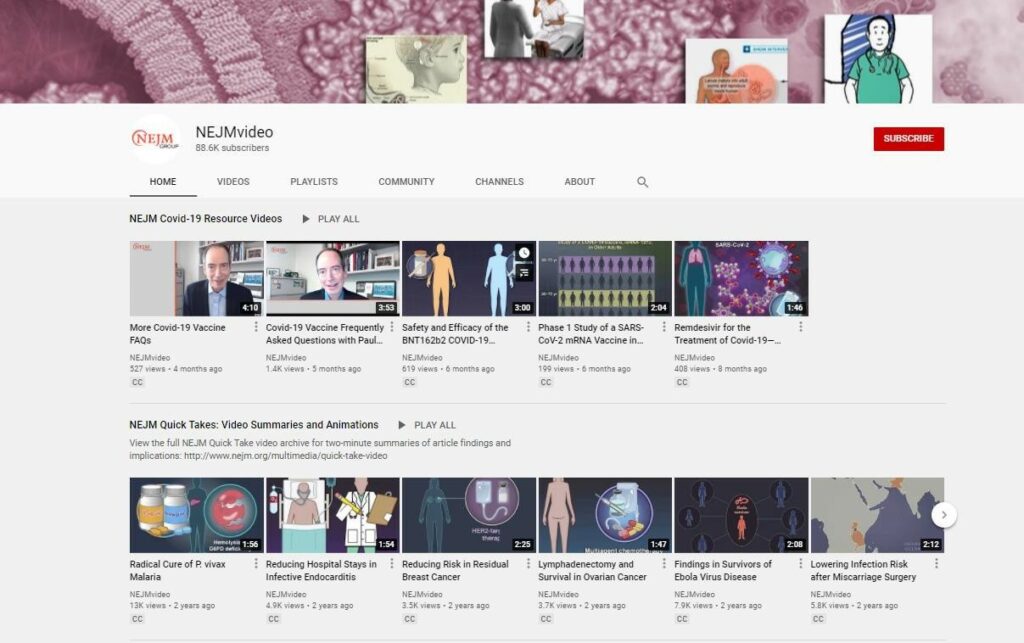
Source: Screenshot NEJMvideo channel (15 July 2021)
Posters
Interactive Posters can be shared via the institutional website or blog, LinkedIn, and directly through targeted email. Posters can be uploaded, also alongside your paper, on Researchgate, Academia.edu, Slideshare, and of course, conference websites, to give you a few options.
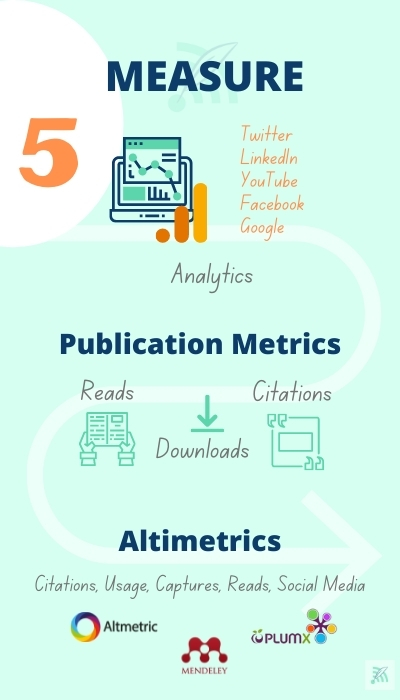
Don't lose sight - Monitor your reach and impact
Last but not least, after having come all the way, you surely want to know how much attention and interest your research has generated, how many readers you’ve had, what your tangible benefits in terms of citations are. And what impact your research had on a broader scale.
As explained before, your online dissemination success can be monitored using either inbuilt analytics (e.g., Twitter, LinkedIn, YouTube Analytics) or services that tie them all together like Sendible or Sprout Social. Google Data Analytics, preferably with the Google Search Console integrated, provides valuable insights as well. Those insights and learnings will feed your future strategies to make your research visible.
The growing social media interest in scholarly articles has led to developing tools to track social media and academic, social network (such as Mendeley, Academia, and ResearchGate) activities around them.
Altmetric and Plum X are the two popular aggregators that track altimetric events like coverage and mentions of articles from various channels. So it’s worth considering them as well.
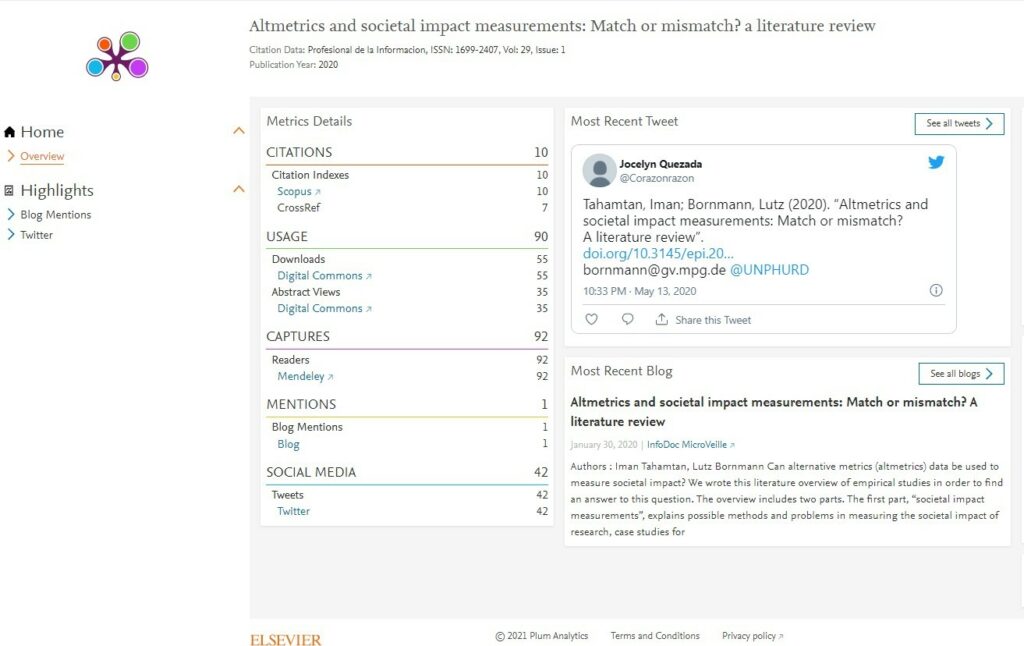
Source: Screenshot PlumX of “Altmetrics and societal impact measurements: Match or mismatch? a literature review” (Elsevier)
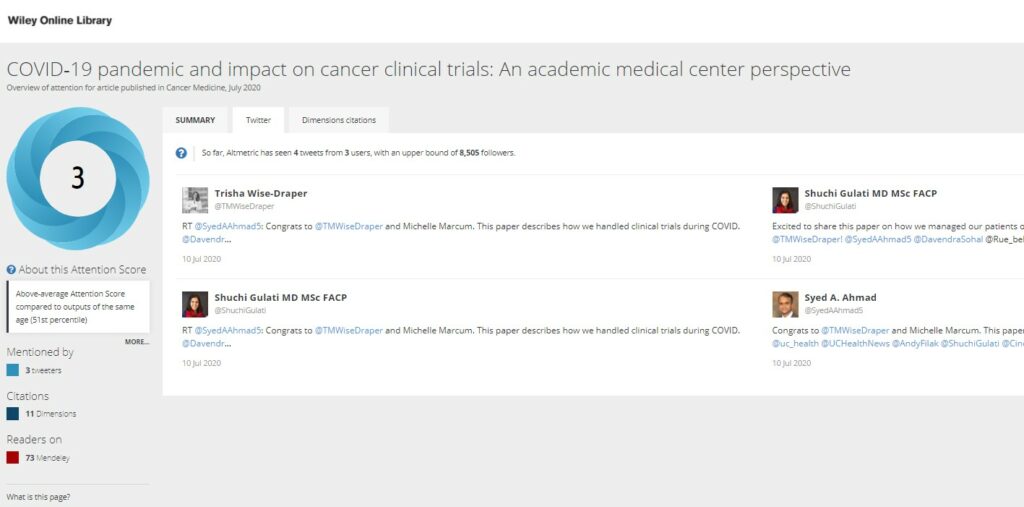
Source: Screenshot of Altimetric Score “COVID‐19 pandemic and impact on cancer clinical trials: An academic medical center perspective” (Wiley)
So even after you are all done, we advise you to monitor your stats regularly. The publications state readers, downloads, citations provided by most journals or academic platforms, and altimetric that measure impact.
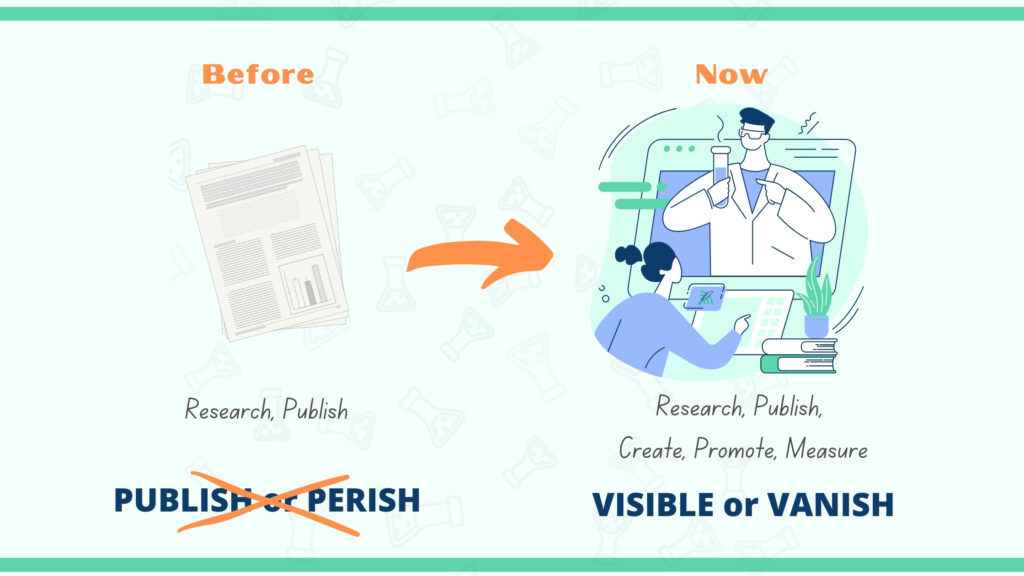
Those who have not done it already: It is time to replace publish or perish with visible or vanish – full throttle.
Feeling overwhelmed – let medtextpert accompany your journey! We can help your research stand out so that your colleagues and family aren’t the only ones reading your articles.