
Increasing Research Visibility & Interest by embracing appropriate online dissemination
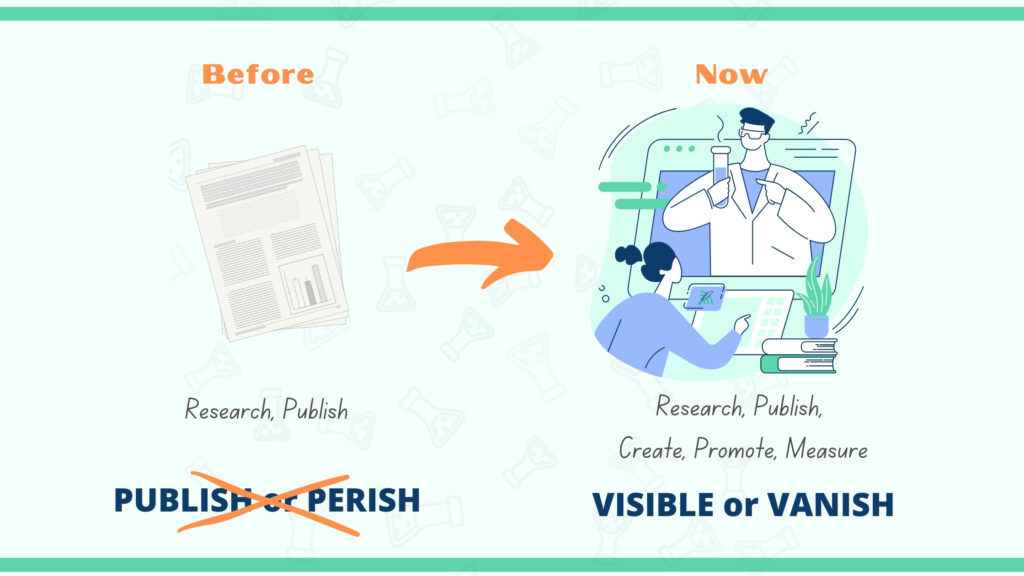
The academic world has changed and research visibility is much harder to achieve. An estimated 2.5 million new papers are published every year. But this number has certainly and substantially increased now due to research interest on Covid-19. Only six months into the pandemic, the number of published coronavirus articles indexed on Web of Science […]
Want An Infographic? – Design-It-Yourself (DIY)
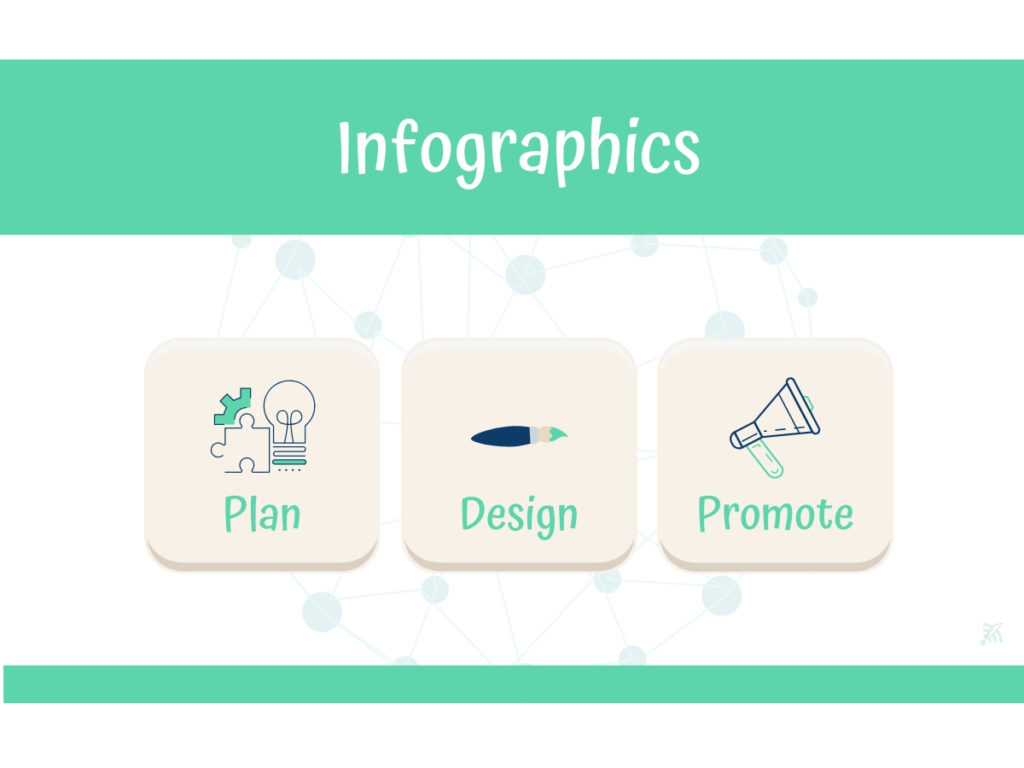
Most of us love visually appealing infographics. But what are they? According to the Oxford English Dictionary, an infographic (or information graphic) is “a visual representation of information or data”. As the name suggests, they combine information and graphics to increase understandability at a glance. In today’s fast-paced information landscape, providing visually attractive content is […]
Graphical Abstracts Made Easy And In Style
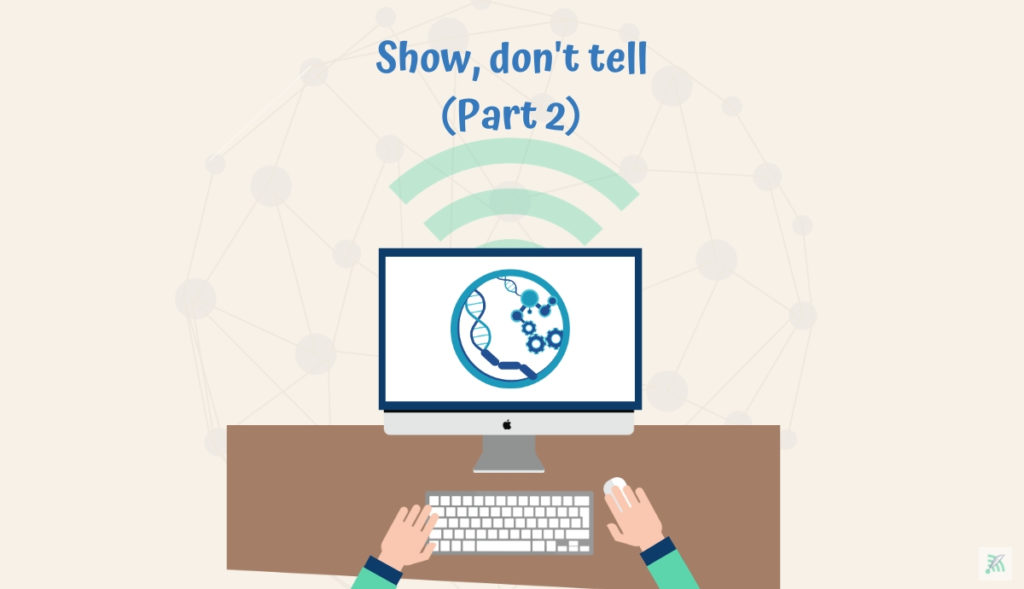
Having understood the added value of a graphical abstract (GA), explained in Part 1 of our “Show, don’t tell” series, the next step is to define how it should be designed and how it can best be used. It is advisable to spend enough time on design, composition and visual appearance to highlight the most […]
Why Your Scientific Publications Need A Graphical Abstract
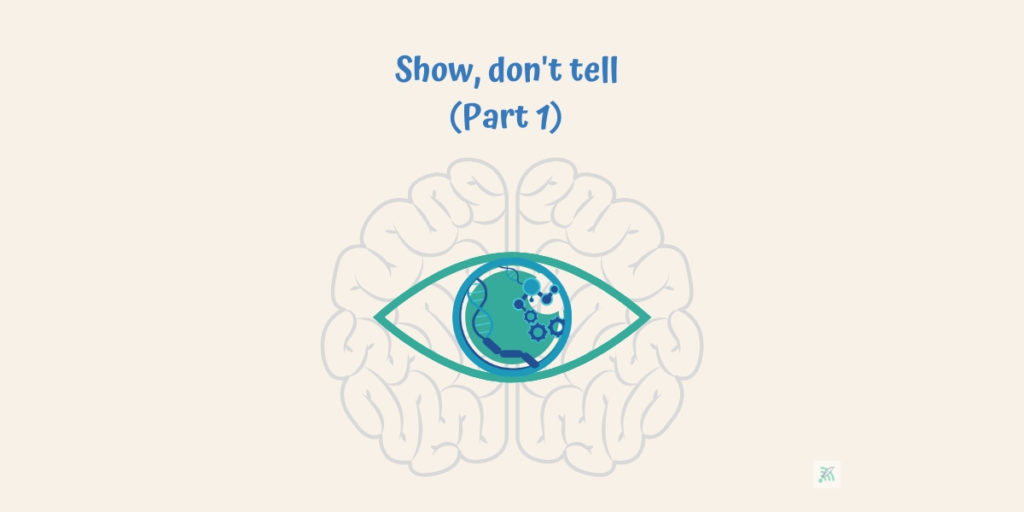
Scientific publishing hasn’t changed a lot since I was born, and that was quite a while ago. It is standardized and has worked efficiently for authors and publishers alike. The optimal article outline consists of title, abstract, background, materials and methods, results and discussion. Add some dreary tables and result diagrams, and years of research […]